JavaScript is a popular programming language used in website development. It is used to make web pages interactive and dynamic. However, when writing JavaScript code, errors can occur. These errors can cause your website to break, and your users may experience problems. To avoid these issues, finding and debugging JavaScript errors is essential. This article will look at the best ways to find and debug JavaScript errors in the browser console.
Contents
Why is JavaScript necessary, and why do errors need to be resolved?
Many modern plugins use JavaScript for various purposes. WP STAGING is a WordPress plugin that relies on JavaScript for real-time backups.
If there is a JavaScript error on your website, it can cause the plugin to stop working. In some cases, only one JavaScript error can stop the execution of JavaScript on the whole site, affecting all other plugins.
To avoid such scenarios, finding and debugging JavaScript errors as soon as possible is essential. Debugging JavaScript errors can be time-consuming, but ensuring your website is functioning correctly is necessary.
How to find JavaScript errors in the browser console?
A browser console is an excellent tool for finding JavaScript errors. It is available in all modern web browsers.
To access the console, please select your specific browser from the following options for detailed instructions:
For crome and other chromium-based browsers, you can open the JavScript console with a right-click on your web page and select "Inspect" or "Inspect Element." This will open the Developer Tools window, and you can switch to the "Console" tab to see any JavaScript errors.
Reload the page: Once you have opened the console, reload the web page. This will refresh the page, and any JavaScript errors that occur will be logged into the console.
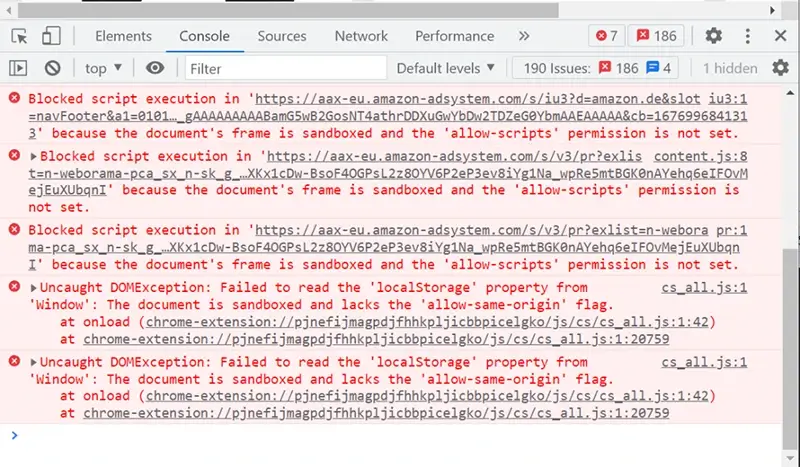
Look for error messages: The console will display JavaScript errors on the page. Look for error messages that indicate what the problem is. The console will tell you the file, line number, and error message. For example, "Uncaught TypeError: Cannot read property ‘length’ of null."
Click on the error message: Clicking on the error message in the console will take you to the code that caused the error. This will make it easier to debug the error.
Fix the error: Once you have found the mistake, fix the problem in your code. Once the error is resolved, please reload the page to ensure it no longer occurs.
Debugging JavaScript errors can be time-consuming, but it is necessary to ensure that your website functions correctly.
Conclusion
In conclusion, finding and debugging JavaScript errors is essential to ensure your website functions correctly. The browser console is an effective way to find and debug JavaScript errors. It is necessary to fix any JavaScript errors as soon as possible to avoid any issues with plugins or website functionality.
Related Articles
- Enable WordPress Debug Log (WordPress Debug Mode)
- How to Speed up Your WordPress Site in 2021 – Ultimate Guide
- How to Clear Browser Cache and Cookies?